
 EJH Group GmbH
Produkte
Marke

*HINWEIS: Gemäß Produktsmodell können Sie FAQs, Proben und Zertifikate suchen.
Hauptseite >>Produkte >>Produktart >>System-Ingenieurbau >>Energiesparprojekte >>Energiemonitoring >>Software Section
PV Applicative Server Bestell-Nr:
Anfrage sendungBitte füllen sie die Details und sagen Sie mir das Ursprungsland, die Markenname und alle Informationen, die Sie schon erhalten. Das wird uns helfen, schnell zu angeboten. Vielen dank!
PV Applicative Server
Energy Sentinel PV

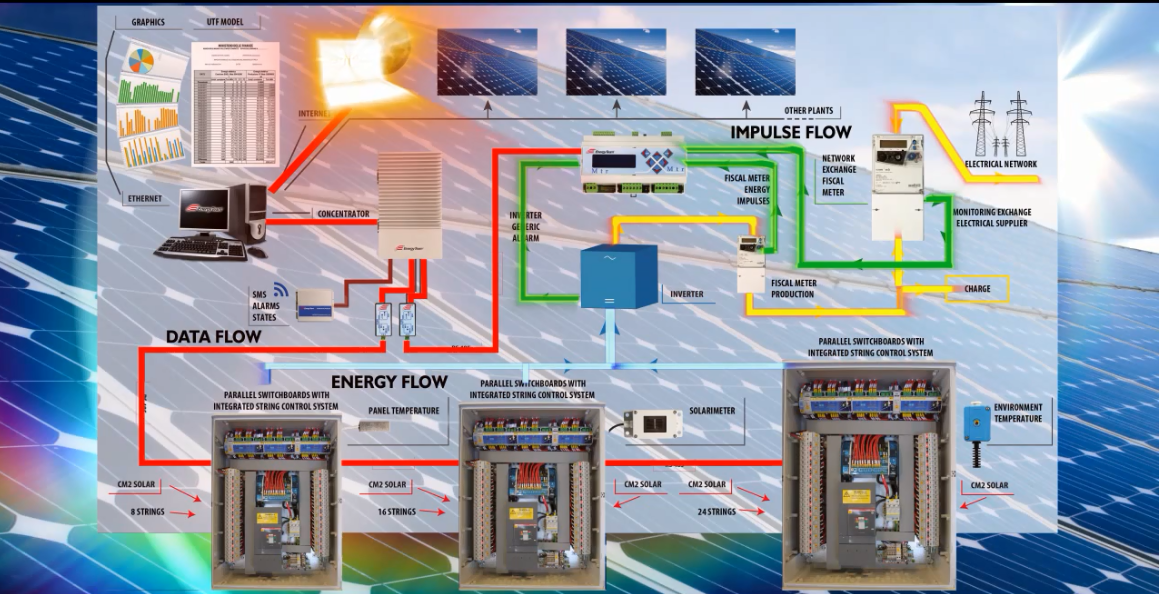
Energy Sentinel PV allows to keep constantly under control all the main information and parameters for managing the productive level of a photovoltaic system. The system includes an application server installed onto an industrial concentrator ( fanless, working temperature – 20 ° + 75° C ) based on Linux architecture, able to acquire data from various devices ( string control, solarimeters, pyranometers, inverters, fiscal meters, weather stations ) distributed within a photovoltaic plant.
Since these information have been collected, stored and analyzed according to standard and customizable models, it’s possible to identify:
-
Inverter efficiency
-
mismatching and string efficiency
-
Photovoltaic system efficiency
-
Photovoltaic system performance
-
Inverter faults
-
Parallel switchboard faults (with CM2)
-
Discharger failure
Besides the consultation via web interface, these information can be used in order to generate early warnings, notifiable by sms and emails. The standard alarms are:
-
String currents control
-
Field switchboard temperature
-
Inverter connection control compared to irradiation
-
Failure inverter control
-
Opening / Closing contacts
-
Thresholds exceed
-
Devices communication failure
The web display is divided into two main areas: real time data and historical data. Real time data can be consulted on the pages that can be easily configured (that is to, you can create configurations specifying the fields to be viewed) in the shape of values or pie chart. Historical can be displayed on a period, selectable in a bar or column graph with two vertical axes to allow comparison among data with very different full scale outputs. The displayed data can be arranged in a table or they can be exported into CVS or excel files.
光伏发电站
